Originally published: July 20, 2024
For four years now, ETP has had fun breaking down every imaginable energy, environmental, and climate issue down into brief, self-contained “talking points” that are easy to understand and share.
Today, I am sharing a new, even shorter form of ETP: Energy Sound Bites. The goal of Energy Sound Bites is to distill key facts and insights about energy, environmental, and climate issues into a form—100 characters or less—that’s short enough to remember and repeat whenever you need them.
I’ll start the Energy Sound Bites series with one of my favorite topics: the future of fossil fuels.
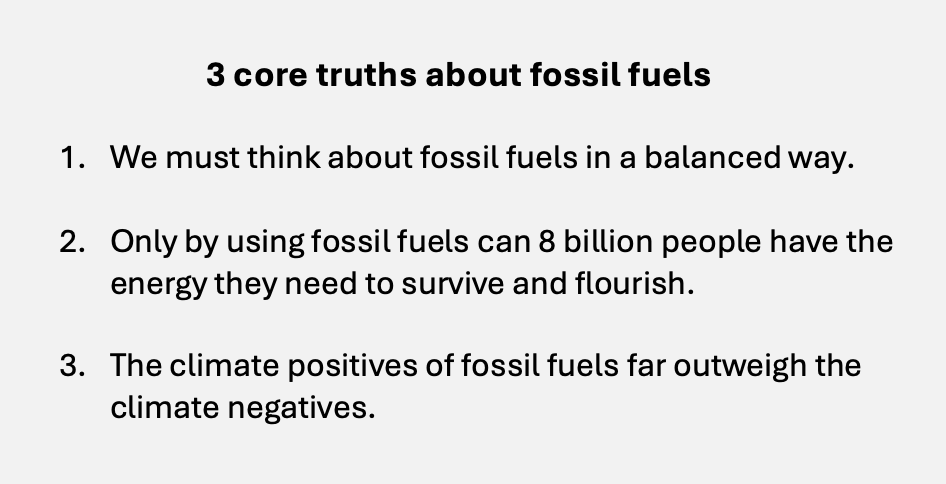
At root, there are 3 core truths about the future of fossil fuels:

Today, I’ll share some Energy Sound Bites to support the first core truth: We must think about fossil fuels in a balanced way.
We must think about fossil fuels in a balanced way.
-
To decide what to do about fossil fuels we must be balanced, looking at both negatives and positives.
-
Most “experts” look at the negatives of fossil fuels but ignore huge positives.
-
Many “experts” ignore that much of the world would starve without fertilizer from natural gas.1
-
Many “experts” ignore that much of the world would starve without oil-powered agricultural machines.
-
-
Fixating on the negatives and ignoring the positives of any technology is deadly.
- If we just looked at the negatives of antibiotics and ignored the positives, billions would die.
-
-
Fossil fuels do impact climate—but even there we must consider positives along with negatives.
- We can’t just look at how warming increases heat waves, we also must look at lives saved from cold.
-
A huge, ignored climate positive we get from fossil fuels is the ability to master climate danger.
-
Fossil fueled cooling allows us to dramatically reduce danger from heat.
-
Fossil fueled heating allows us to dramatically reduce danger from cold.
-
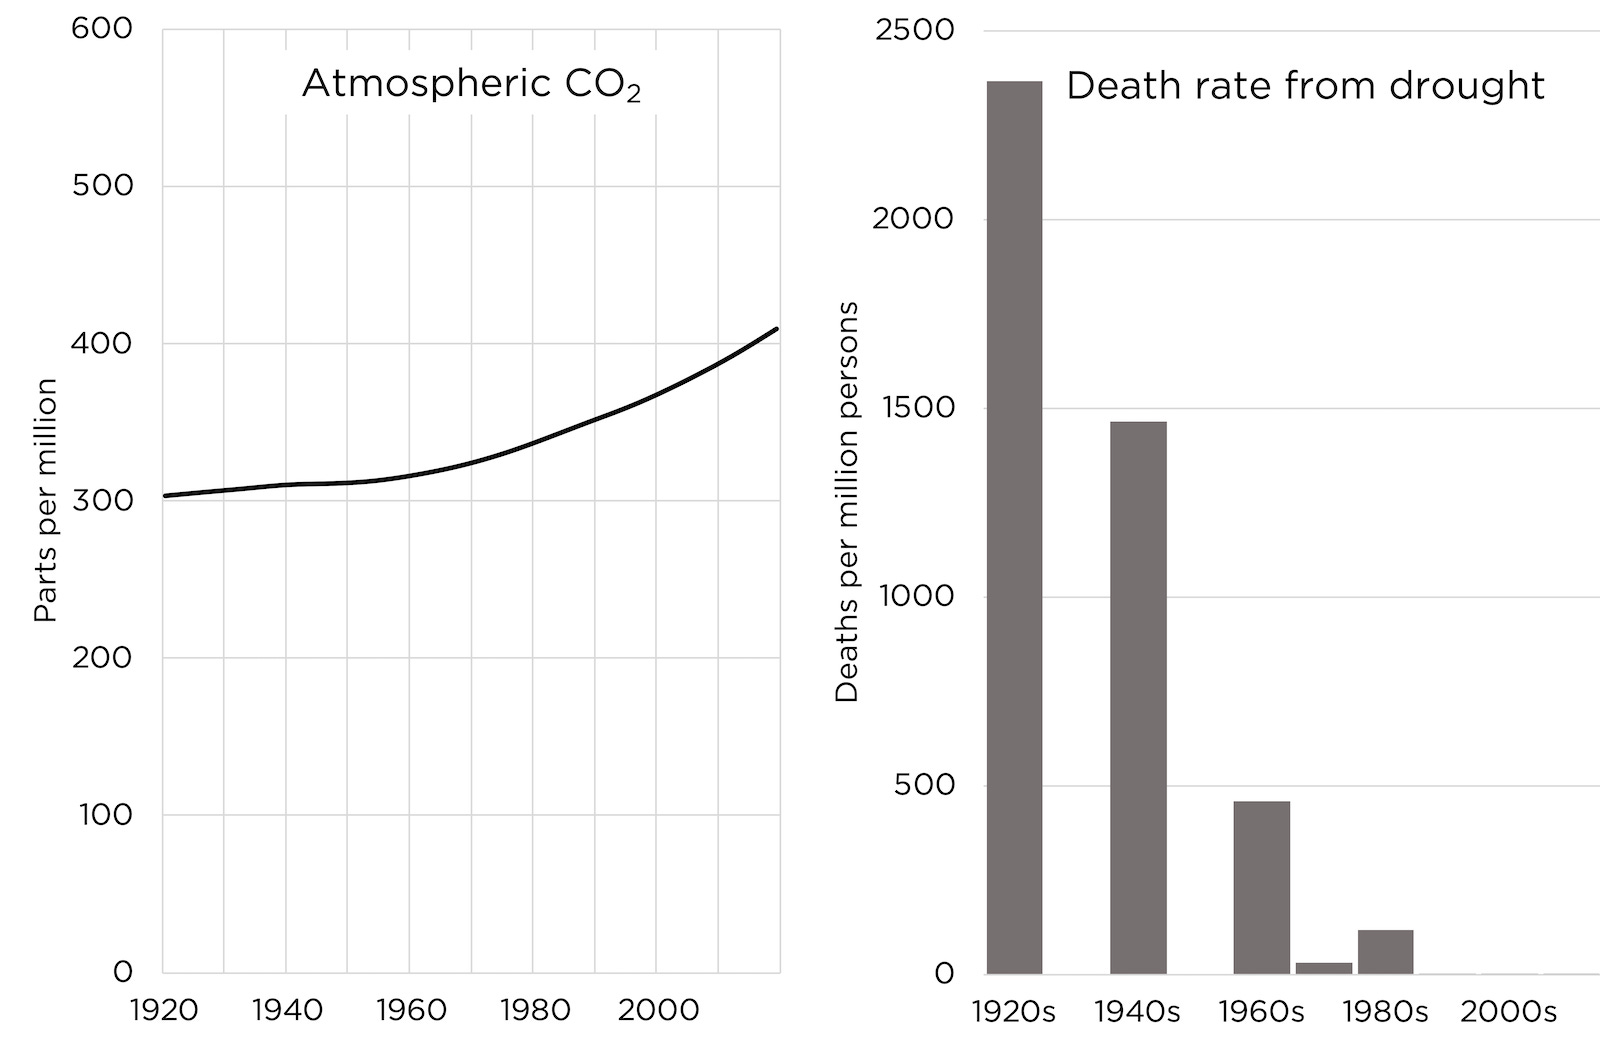
Fossil fueled irrigation allows us to dramatically reduce danger from drought.2

-
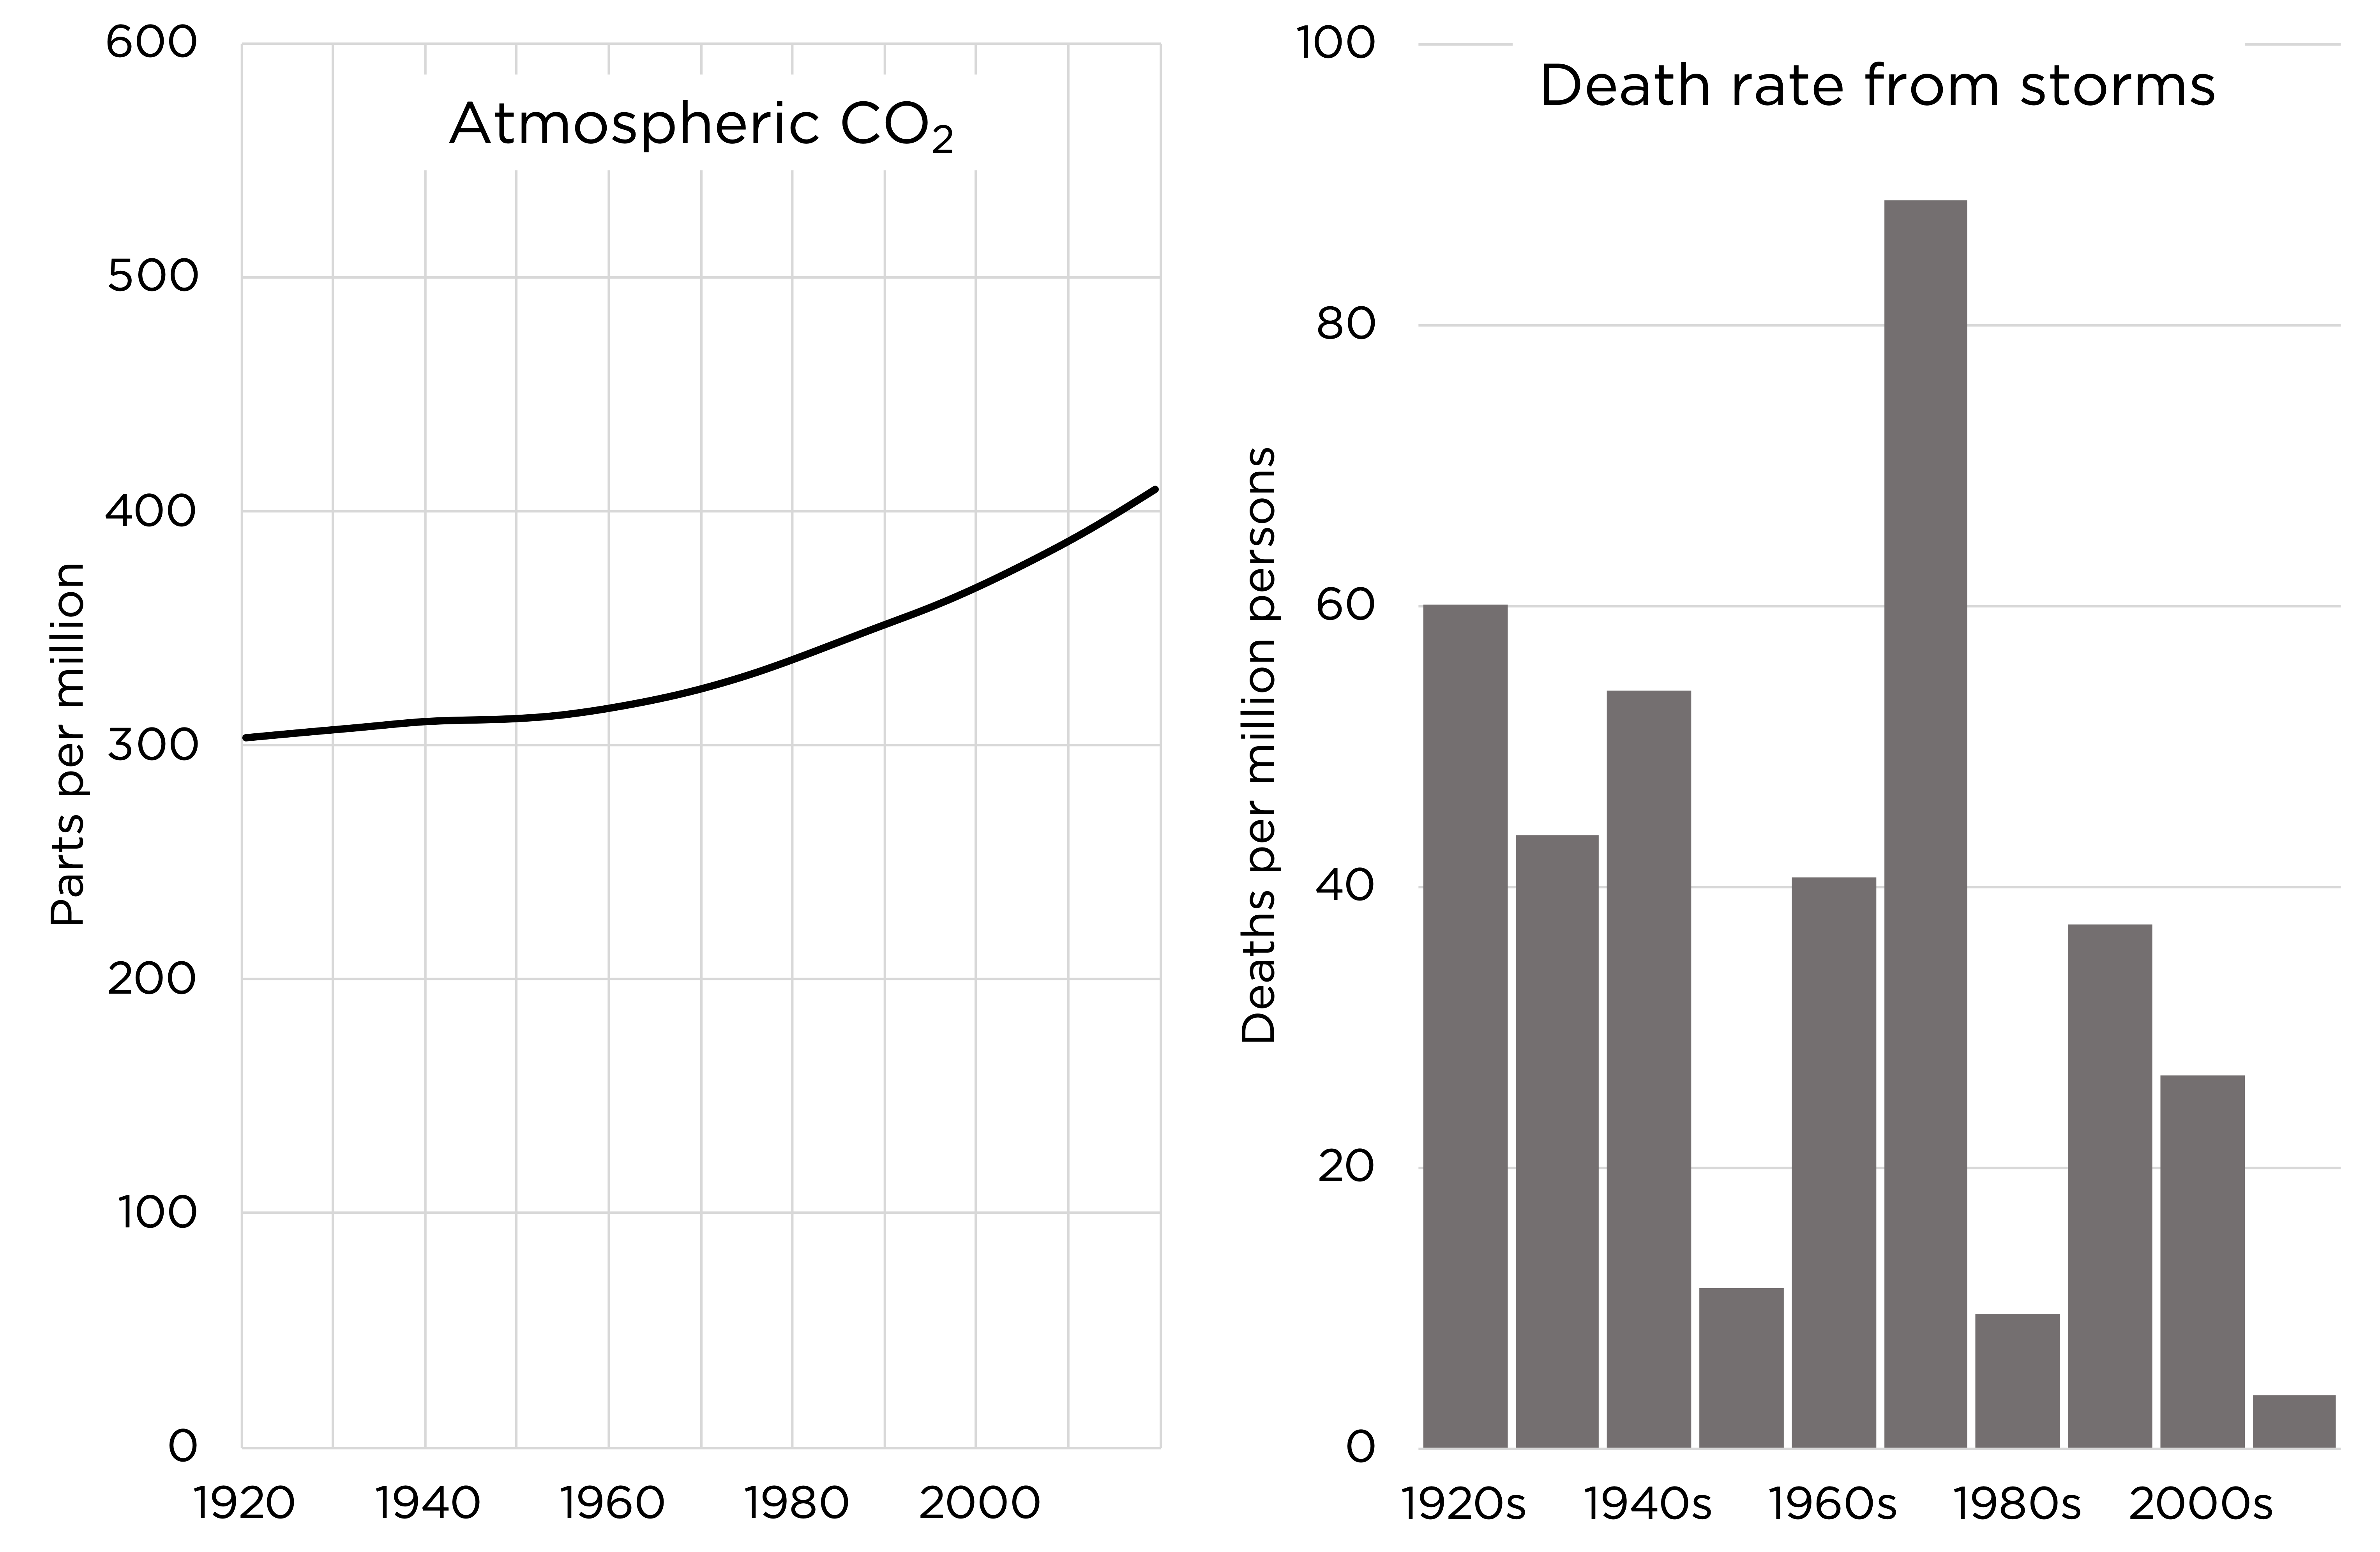
Fossil fueled evacuation systems allow us to dramatically reduce danger from storms.3

-
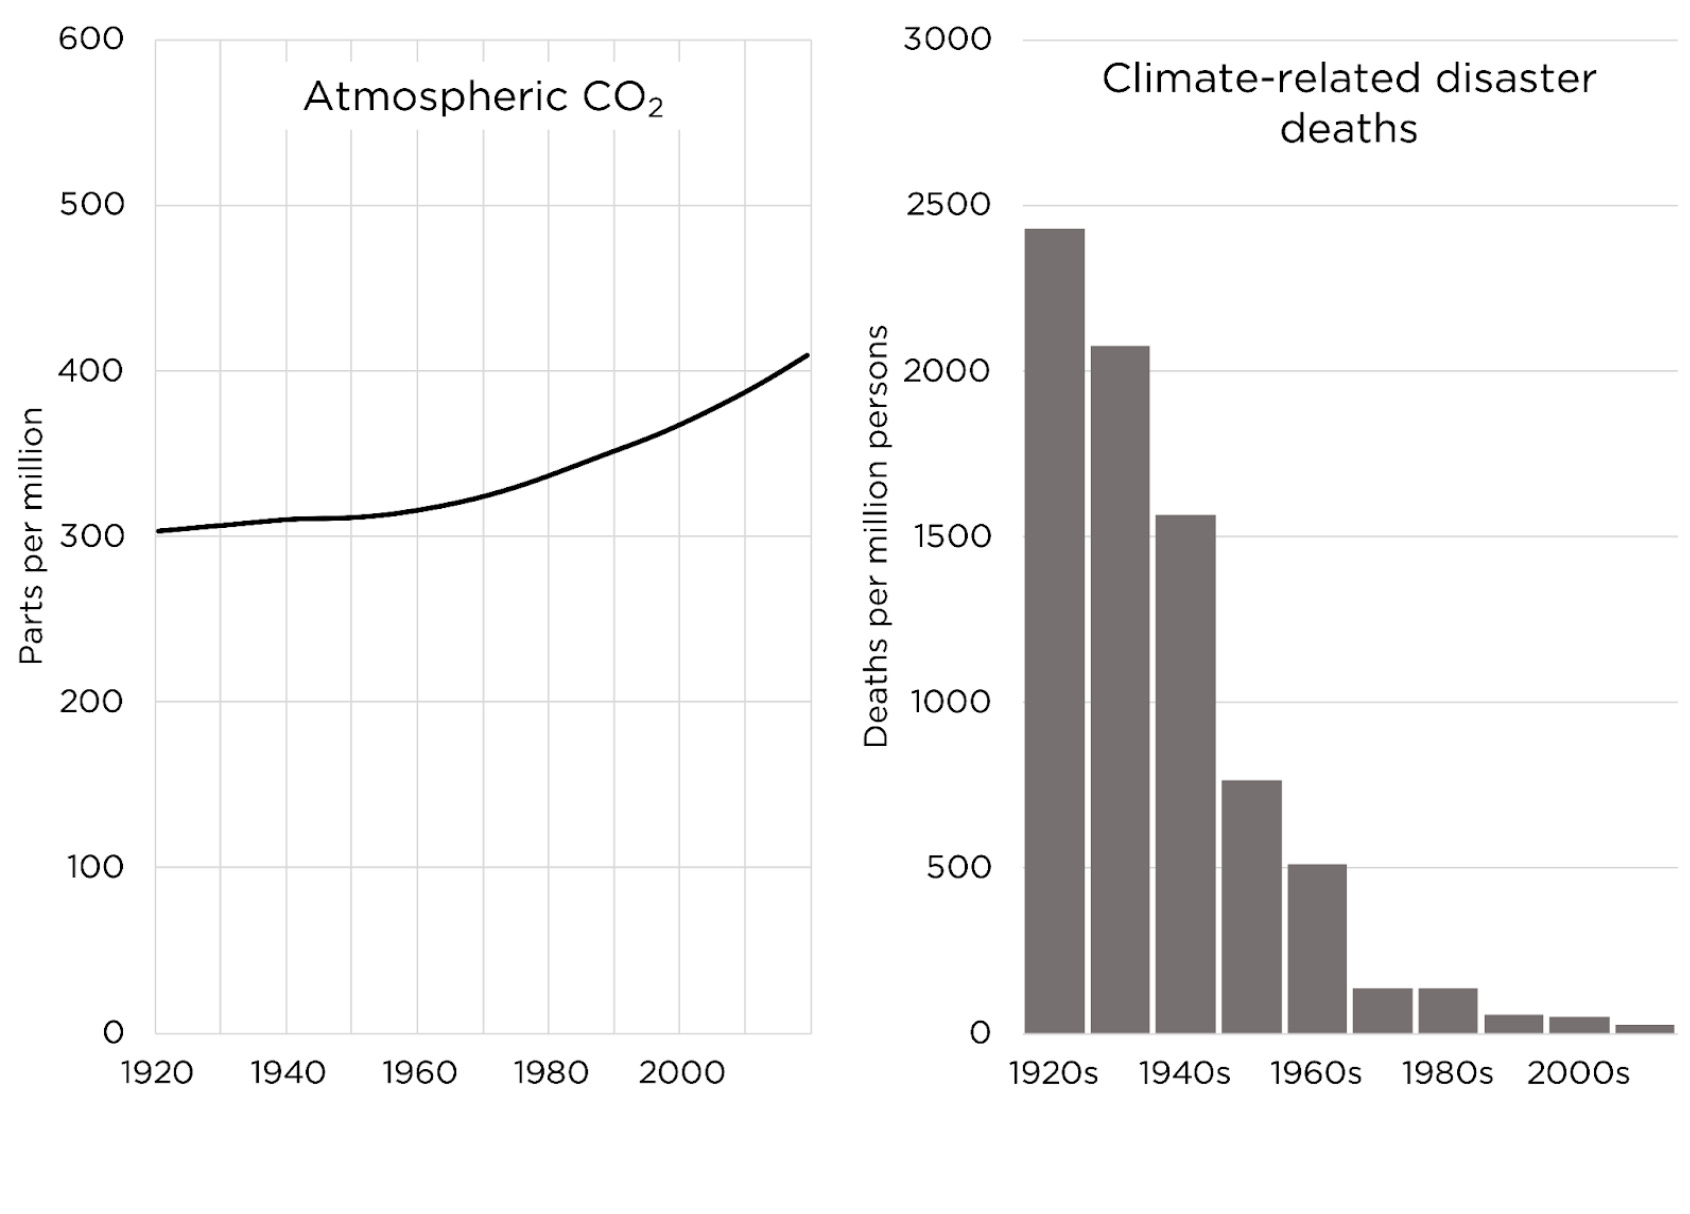
Fossil fueled climate mastery has helped us become safer than ever from climate.
-
The climate death rate has decreased by 98% over the last century as fossil fuel use has risen.4

-
Sadly most “experts” ignore fossil fuels’ climate positives, including climate mastery.
- The IPCC’s 1000+ page climate reports ignore all the ways fossil fuels increase climate safety.
-
-
In weighing fossil fuels’ positives and negatives, we must be precise—not exaggerate or fabricate.
-
Sadly many “experts” exaggerate the negatives of fossil fuels in addition to ignoring the positives.
- Al Gore portrays 20 ft sea level rise as imminent when extreme UN projections are 3 ft / 100 years.5
-
If we carefully weigh fossil fuels’ positives and negatives, it becomes clear we need more of them.
-
Next up: Only by using fossil fuels can 8 billion people have the energy they need to survive and flourish.
Michelle Hung contributed to this piece.
References
-
Climate scientist Michael Mann’s book on fossil fuels and climate doesn’t once mention the essential benefit of fossil fuel use to the availability of food—even though 8 billion people depend on diesel machinery and natural gas fertilizer to eat!
Michael E. Mann, Tom Toles - The Madhouse Effect↩ -
UC San Diego - The Keeling Curve
For every million people on earth, annual deaths from climate-related causes (extreme temperature, drought, flood, storms, wildfires) declined 98%--from an average of 247 per year during the 1920s to 2.5 per year during the 2010s.
Data on disaster deaths come from EM-DAT, CRED / UCLouvain, Brussels, Belgium – www.emdat.be (D. Guha-Sapir).
Population estimates for the 1920s from the Maddison Database 2010, the Groningen Growth and Development Centre, Faculty of Economics and Business at University of Groningen. For years not shown, population is assumed to have grown at a steady rate.
Population estimates for the 2010s come from World Bank Data.
-
UC San Diego - The Keeling Curve
For every million people on earth, annual deaths from climate-related causes (extreme temperature, drought, flood, storms, wildfires) declined 98%--from an average of 247 per year during the 1920s to 2.5 per year during the 2010s.
Data on disaster deaths come from EM-DAT, CRED / UCLouvain, Brussels, Belgium – www.emdat.be (D. Guha-Sapir).
Population estimates for the 1920s from the Maddison Database 2010, the Groningen Growth and Development Centre, Faculty of Economics and Business at University of Groningen. For years not shown, population is assumed to have grown at a steady rate.
Population estimates for the 2010s come from World Bank Data.