Quick summary
- America’s future depends on America’s energy industry. Energy is the industry that powers every other industry. The lower cost and more reliable our energy is, the more competitive every American company is and the lower the cost of living is for every American.
- In the last 15 years America has become a world energy leader largely through enormous growth in producing the #1 and #3 forms of energy in the world: oil and natural gas. This was only possible because of our unrivaled freedom to develop and innovate.1 2
- America can only remain an energy leader if we continue producing fossil fuels--the world’s largest and fastest-growing source of energy. Fossil fuels are by far the lowest cost source of energy for billions of people. Unreliable solar and wind can’t come close.3 4
- Contrary to the myth that CO2 emissions from fossil fuels are causing a climate crisis, the climate death rate is actually lower than ever thanks to human adaptation. Rising CO2 levels will continue to cause manageable warming as well as significant global greening--not a crisis.5 6 7
- The only way to lower CO2 emissions and benefit America is to promote innovation that makes low-carbon energy truly reliable and low-cost. Are China and India going to stop using fossil fuels so long as they are the lowest-cost option? They won’t and they shouldn’t.
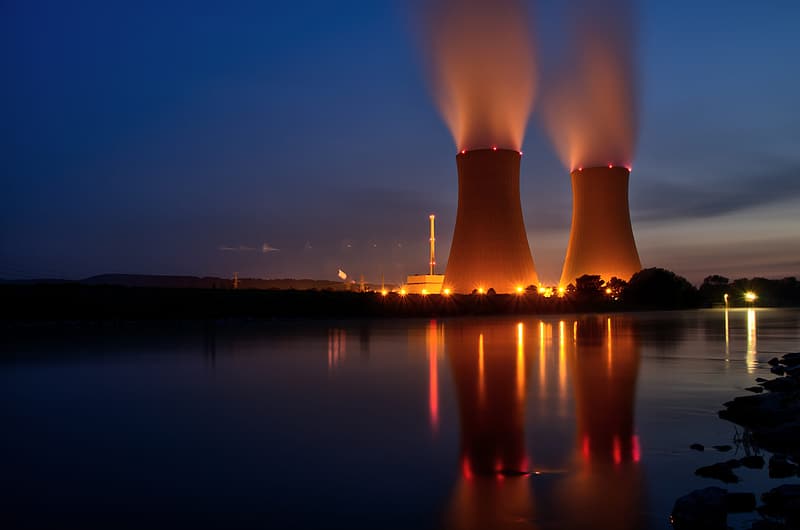
- America can lower emissions and energy costs by decriminalizing nuclear energy. Nuclear is actually the safest source of energy and the only way to provide reliable non-carbon electricity anywhere in the world. Yet politicians are overregulating it to death.8
- If America tries to rapidly eliminate fossil fuel use through a Green New Deal or Biden Climate Plan we will not prevent a crisis, we will cause a crisis by making energy completely unreliable and unaffordable for American industry and American consumers.
- America needs more energy freedom across the board, including in nuclear energy, fracking, development of federal lands, development offshore, pipelines, and export terminals--all of which can be done safely and responsibly.
References
-
“The United States surpassed Russia in 2011 to become the world's largest producer of natural gas and surpassed Saudi Arabia in 2018 to become the world's largest producer of petroleum.”
U.S. Energy Information Administration, August 20, 2019↩ -
“The U.S. Energy Information Administration (EIA) estimates that in 2019, about 2.81 billion barrels (or 7.7 million barrels per day) of crude oil were produced directly from tight oil resources in the United States. This was equal to about 63% of total U.S. crude oil production in 2019.” -U.S. Energy Information Administration↩
-
From 2018 to 2019 the consumption of coal, oil, and gas combined grew by 3.44 exajoules, despite a slight decline in coal consumption, compared to 3.15 exajoules for non-hydro renewables, 0.32 exajoules for hydroelectricity, and 0.76 exajoules for nuclear.\
Since 2015 fossil fuel consumption grew by over 26 exajoules, compared to over 10 exajoules for non-hydro renewables.
BP Statistical Review of World Energy – all data, 1965-2019↩
-
Oil, gas, and coal provided 488.9 exajoules, or 83.9% of the world’s energy consumption in 2019. Solar and wind provided a combined 3.3%.
BP Statistical Review of World Energy – all data, 1965-2019↩
-
For every million people on earth, annual deaths from climate-related causes (extreme temperature, drought, flood, storms, wildfires) declined 98%--from an average of 247 per year during the 1920s to 2.5 in per year during the 2010s.
Data on disaster deaths come from EM-DAT, CRED / UCLouvain, Brussels, Belgium – www.emdat.be (D. Guha-Sapir).\
Population estimates for the 1920s from the Maddison Database 2010 come from the Groningen Growth and Development Centre, Faculty of Economics and Business at University of Groningen. For years not shown population is assumed to have grown at a steady rate.
Population estimates for the 2010s come from World Bank Data.
Using the average world population in the 1980s (4.8 billion) and the 2010s (7.3 billion) and the average deaths per year from all meteorological, hydrological, and climatological disasters for both decades (66,697 and 18,342 respectively), the annual deaths rates per one million people from climate-related disasters has declined by over 80% from 13.8 to 2.5.\
Disaster deaths from EM-DAT, CRED / UCLouvain, Brussels, Belgium – www.emdat.be (D. Guha-Sapir).\
Population estimates from World Bank Data.↩
-
See The So-Called Climate Crisis at energytalkingpoints.com.↩
-
Regional trends vary, but overall the world's leaf area increased by 5.4 million square kilometers, or an amazon rainforest worth of greening, between 2000 and 2017 alone with over 1/3 of vegetated land showing an increase while only 5% showed a loss of green vegetation.
“Long-term satellite records reveal a significant global greening of vegetated areas since the 1980s, which recent data suggest has continued past 2010. …
Global vegetation models suggest that CO2 fertilization is the main driver of global vegetation greening.” - Piao, S., Wang, X., Park, T. et al. Characteristics, drivers and feedbacks of global greening. Nat Rev Earth Environ 1, 14–27 (2020).↩ -
Nuclear energy is statistically the safest form of energy production by a wide margin, regardless of whether one takes into account speculative health impacts from air pollution, which nuclear technology does not create. No other relevant technologies cause so few casualties per unit of energy produced.\
World Nuclear Association - Safety of Nuclear Power Reactors↩